



TL;DR
An employee pulse survey is a short, frequent check-in — usually five to ten questions — that measures how employees feel in near real time. It supplements the annual employee survey rather than replacing it, and its value depends far more on what happens after the results arrive than on the survey itself.
Key takeaways
- Pulse surveys measure direction and change. Annual surveys measure depth and benchmarks.
- Five to ten questions, answerable in under two minutes, is the working standard.
- Monthly or quarterly suits most organisations. Weekly is rarely sustainable.
- Response rates for pulses run lower than for annual surveys, and vary widely by source.
- A falling response rate is the most reliable warning sign in the whole programme.
- Surveys that produce no visible action stop producing honest data.
The case for measuring employee sentiment more often has not been difficult to make for some time.
According to Gallup’s State of the Global Workplace: 2026 report, 20% of employees worldwide are engaged at work. Sixty-four percent are not engaged, and 16% are actively disengaged. Manager engagement fell from 27% in 2024 to 22% in 2025 — a decline concentrated in exactly the layer most organisations rely on to act on survey results.
An annual survey detects this once a year. By the time the report is circulated, the conditions it describes have often changed.
Pulse surveys were designed to close that interval. Whether they succeed depends less on frequency than on what the organisation does between cycles.
What is an employee pulse survey?
An employee pulse survey is a brief, recurring questionnaire that measures how employees feel about their work, their manager, their team, or a specific recent change.
Three characteristics distinguish it from other survey formats.
It is short
Five to ten questions is the working standard. Most use rating scales or multiple choice, with one optional open text field. The target completion time is under two minutes.
Length is not a convenience decision. It determines whether the survey gets finished on a phone between meetings, which determines the response rate, which determines whether the data represents anyone.
It is frequent
Pulses run on a cadence — monthly and quarterly are the most common. The point of repetition is trend data. A single pulse produces a number. Six produce a direction, and direction is what leadership can act on.
It is focused
An annual survey attempts to cover the whole employee experience. A pulse survey covers one theme: workload, manager support, a recent reorganisation, a return-to-office change, or confidence in leadership.
Narrow scope is what makes fast action possible. Broad results require interpretation. Focused results point somewhere.
What is the primary purpose of a pulse survey?
The primary purpose of a these survey is to detect change early enough to act on it.
That is a narrower job than it first appears. Measuring engagement is not the purpose — the annual survey does that more reliably, with better benchmarks and deeper segmentation. The pulse exists to shorten the interval between something going wrong and someone noticing.
An annual survey reports on a year. A pulse reports on a quarter, a month, or a single change. The value is in the shorter gap, not the extra data.
What are the benefits of pulse surveys?
Six benefits account for most of why organisations run them.
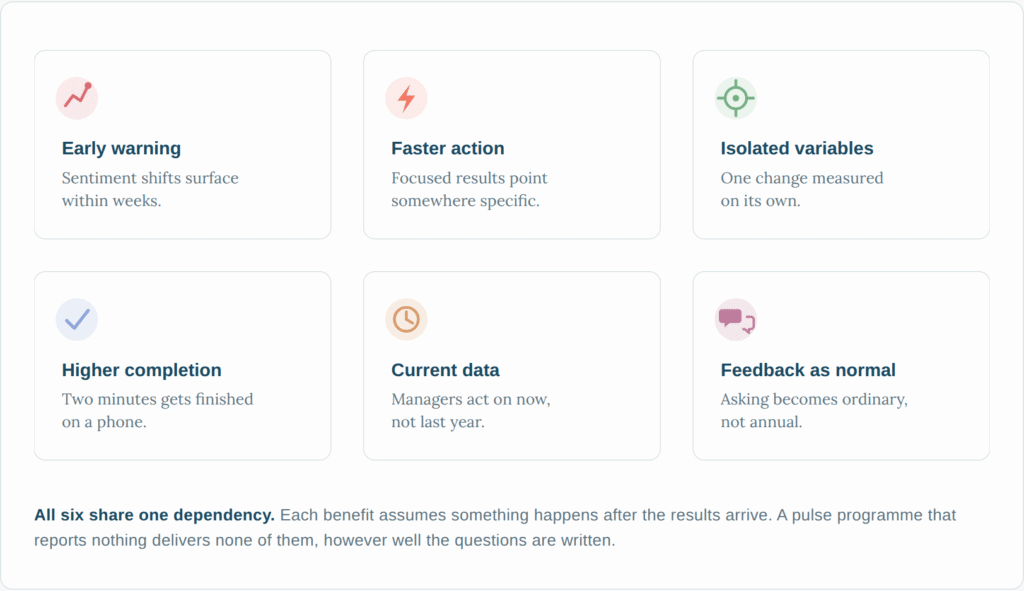
- Early warning. Sentiment shifts surface within weeks rather than at the next annual cycle.
- Faster action. A focused result points somewhere specific, so the response does not wait on interpretation.
- Isolated variables. Running a pulse around one change shows the effect of that change rather than everything at once.
- Higher completion. A two-minute survey gets finished on a phone between meetings.
- Current data for managers. Managers act on what is happening now, not on a report describing last year.
- Feedback becomes ordinary. Regular, low-effort asking normalises two-way communication instead of concentrating it into one annual event.
Each of these depends on the same condition. A pulse programme delivers none of them if results arrive and nothing follows.
What pulse surveys do well, and what they do not
Pulse surveys are often sold as a replacement for annual listening. They are not, and the limitations are worth stating before a programme is designed around them.
| Strengths | Limitations |
|---|---|
| Detects sentiment shifts within weeks rather than months | Rarely explains why a score moved without a follow-up conversation |
| High completion rates because the survey is short | Response rates decline quickly if no action follows |
| Measures the impact of a specific change while it is happening | Small samples in small teams fall below anonymity thresholds |
| Normalises two-way communication as ordinary rather than annual | Frequent surveying without change creates fatigue and cynicism |
| Produces trend data that isolates a single variable | Insufficient depth for benchmarking or driver analysis |
| Low administrative load per cycle | Continuous cadence means continuous ownership |
The most common failure is not a bad question set. It is a well-designed programme with no mechanism for acting on what it finds.
How often should you run a pulse survey?
Cadence should be set by how quickly the organisation can respond, not by how often the employee pulse software permits a send.
| Cadence | Works when | Risk |
|---|---|---|
| Weekly | Running a short diagnostic during a specific change — a merger, a system migration, a restructure | Unsustainable beyond a few weeks; fatigue sets in fast |
| Monthly | Managers have a standing forum to review and respond to results | Becomes routine noise without visible follow-through |
| Quarterly | Most organisations, most of the time | May miss short-lived issues between cycles |
| Event-based | Measuring reaction to a defined change — policy shift, leadership announcement, office move | No trend line without a regular cadence alongside it |
What topics should a pulse survey cover?
One topic per cycle. Rotating them is what keeps a programme useful over a year — the same five questions asked twelve times measures habit, not experience.
| Topic | What it tells you | Run it when |
|---|---|---|
| Manager support | The strongest single predictor of team engagement | At least twice a year |
| Workload and capacity | Early burnout signal, usually months ahead of resignations | After peak periods and headcount changes |
| Recognition and feedback | Whether good work is being noticed, and by whom | Quarterly; declines fast and quietly |
| Wellbeing and stress | Where support is needed and whether people know it exists | Alongside wellbeing programme launches |
| Career growth | Retention risk among high performers | Before and after review cycles |
| Communication and change | Whether decisions are landing or only being announced | During any restructure or policy shift |
| Tools and resources | Friction that is fixable without budget conversations | Annually, or after systems changes |
| Belonging and team connection | Isolation on hybrid and distributed teams | Twice a year, more for remote-heavy teams |
| Confidence in leadership | Whether direction is understood and believed | After strategy announcements or leadership changes |
| Speaking up | Whether the rest of your survey data can be trusted | Annually; a low score reframes everything else |
A workable quarterly rotation
Anchor questions stay constant every cycle. The rotating topic changes.
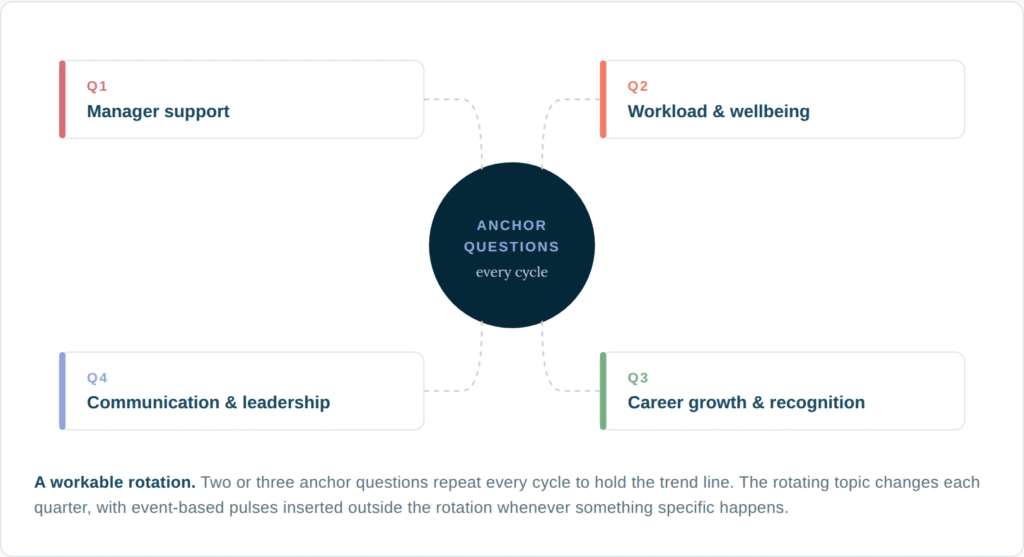
| Quarter | Rotating topic | Why here |
|---|---|---|
| Q1 | Manager support | Sets the baseline on the variable that moves everything else |
| Q2 | Workload and wellbeing | Catches strain building through the first half of the year |
| Q3 | Career growth and recognition | Lands before review season, while there is still time to act |
| Q4 | Communication and confidence in leadership | Tests whether the year’s decisions were understood |
Insert an event-based pulse outside the rotation whenever something specific happens. A reorganisation, an office move, or a new policy deserves its own measurement rather than a line in the next scheduled cycle.
One topic to avoid asking about casually
Compensation. A pulse question on pay generates strong responses and almost never a response the organisation can act on within a quarter. Cover it in the annual survey, where the results sit next to the context and the planning cycle that can actually address them.
Employee pulse survey questions
Pick one theme per cycle. Rotate themes across cycles. Keep two or three anchor questions constant so a trend line exists.
Anchor questions — repeat every cycle
Constant across cycles
- I would recommend this organisation as a good place to work.
- I have the resources I need to do my job well.
- I feel supported by my manager.
Rotating theme questions
Workload and capacity
- My workload is manageable in a normal week.
- I can take time off when I need it without difficulty.
- I rarely work outside my normal hours to keep up.
Recognition and feedback
- I received recognition for good work in the past two weeks.
- I get useful feedback often enough to improve.
- I understand how my work contributes to team goals.
Wellbeing
- I am able to maintain a reasonable balance between work and personal life.
- I know where to go if I need support with my wellbeing.
- Stress at work is at a level I can manage.
Change and communication
- I understand the reasons behind recent changes.
- I hear about decisions that affect me in good time.
- I can raise a concern without worrying about the consequences.
Close each pulse with a single open question — “What is one thing we should change?” — and nothing more. Two open fields halve the completion rate on the second.
Quick tips for writing pulse survey questions
Nine rules cover most of what goes wrong.
- One idea per question. “My manager gives clear direction and useful feedback” measures two things and reports neither.
- Anchor to a timeframe. “In the past two weeks” produces a recall. “Generally” produces a mood.
- Ask about behaviour, not opinion. “I received recognition for good work in the past two weeks” is answerable. “Recognition is valued here” is a guess about other people.
- Keep the scale consistent across cycles. Switching between five-point and seven-point scales breaks the trend line.
- Keep the scale pointing the same way. Flipping the positive and negative ends mid-survey produces data that looks like disagreement and is actually confusion.
- Avoid leading language. “How much do you value our new wellbeing programme?” assumes the answer. “Our wellbeing programme is useful to me” does not.
- Cut the jargon. Write the question the way a manager would say it out loud. If a phrase only appears in HR documents, replace it.
- Do not ask about what cannot change. A question about a fixed policy collects frustration and spends trust.
- Test on five people first. Ambiguity is obvious to a reader and invisible to the writer.
The two-minute check
Read the full survey aloud before sending it. Anything that sounds like a policy document rather than a question gets rewritten. Anything that takes more than two minutes to answer gets cut.
Employee pulse survey examples
Four complete surveys, ready to send. Each uses a five-point agreement scale — strongly disagree to strongly agree — unless noted.
Example 1 — Quarterly recurring pulse (5 questions)
- I would recommend this organisation as a good place to work.
- I have the resources I need to do my job well.
- I feel supported by my manager.
- My workload is manageable in a normal week.
- What is one thing we should change? (open text, optional)
The standing programme. Questions 1–3 are the anchors and never change. Question 4 rotates by topic each quarter.
Example 2 — Post-reorganisation pulse (6 questions)
- I understand the reasons behind the recent changes.
- I am clear on what my role looks like now.
- I know who to go to with questions about the change.
- I heard about the changes in good time.
- I feel able to raise concerns about how this is going.
- What is still unclear to you? (open text, optional)
Send two to three weeks after the announcement — long enough for reality to land, early enough to correct course.
Example 3 — New hire 30-day pulse (5 questions)
- My onboarding prepared me for my role.
- I had the equipment and access I needed on day one.
- My manager has been available when I needed them.
- I understand how my work contributes to team goals.
- What would have made your first month easier? (open text, optional)
A lifecycle pulse, triggered by start date rather than calendar. Repeat at 90 days with the same questions to see what changed.
Example 4 — Wellbeing and workload pulse (5 questions)
- I am able to maintain a reasonable balance between work and personal life.
- Stress at work is at a level I can manage.
- I can take time off when I need it without difficulty.
- I know where to go if I need support with my wellbeing.
- I rarely work outside my normal hours to keep up.
Question 4 is the useful one. A low score there usually means the support exists and nobody can find it — which is a communication fix rather than a budget one.
Before you copy any of these
Check each question against something you could plausibly change this quarter. A question that cannot lead anywhere collects frustration and spends trust. Cut it and send four questions instead of five.
What response rate should you expect?
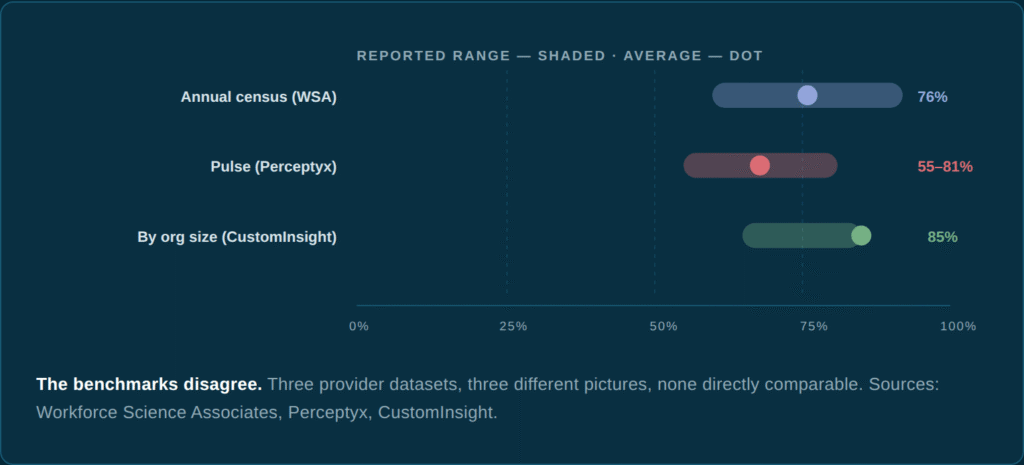
Published pulse survey benchmarks vary so widely that any single figure should be treated with caution. The ranges below come from different provider datasets and are not directly comparable.
- 76% A verage response rate for annual census surveys, per Workforce Science Associates, with a typical range of 60–92%
- 55–81% Pulse survey range across Perceptyx client data, against 72–88% for census surveys
- 85% Benchmark average for organisations under 500 employees, per CustomInsight, falling to 65% above 5,000
Two points are consistent across sources despite the spread.
Pulse response rates sit below annual survey rates. Annual surveys receive dedicated communication, leadership sponsorship, and often protected time. Pulses usually receive an email.
Organisation size drives the number more than survey design does. Smaller organisations consistently report higher participation. Comparing a 300-person company against an enterprise benchmark produces a misleading conclusion in both directions.
The number that matters more than the benchmark
A declining response rate across consecutive cycles is the single most reliable indicator of programme health.
An absolute rate reflects organisation size, industry, workforce composition, and access to devices. A downward trend reflects one thing: employees have concluded that responding does not change anything.
Track the trend. Treat the benchmark as context.
How Woliba approaches pulse surveys
Woliba includes pulse surveys as part of its work-life infrastructure rather than as a standalone listening product.
The practical difference is where the results land. A sentiment score on its own tells an HR team that something moved. The same score beside challenge participation, recognition activity, and wellbeing engagement usually tells them what moved and where.
Woliba Intelligence™ reads those signals together, flagging engagement risk and emerging burnout patterns before they appear in turnover data. Survey results sit on the same dashboard as the programmes an organisation would use to respond to them — recognition, coaching, habit challenges, and preventive health prompts across the 12 Pillars of Wellbeing.
Gilsbar is a useful illustration. Challenge participation rose from 55% to 90%, logged activities increased 406%, and social feed posts went from 46 to 438. Sentiment data was informative in that programme because there was somewhere to route it.
Woliba is priced at $2 per active user per month, published, and runs in under an hour of administrative time a month. For teams whose reason for delaying a pulse programme is capacity rather than conviction, that is usually the relevant number.